Help Centre
Support > Ecommerce > Selling Online
Understanding Shop Reports with your Create Shop
With Create's "Shop Reports" system you can keep track of your shop's profit and best selling items. Shop Reports are really easy to use and will update automatically when orders come through your shop.
To start viewing your shop's reports, simply follow the steps below:
- Log in to your account.
- Click on "Shop" via your Top Menu.
- Select "Shop Reports" from the left-hand menu.
Below is a summary of the graphs on your "Shop Reports" screen.
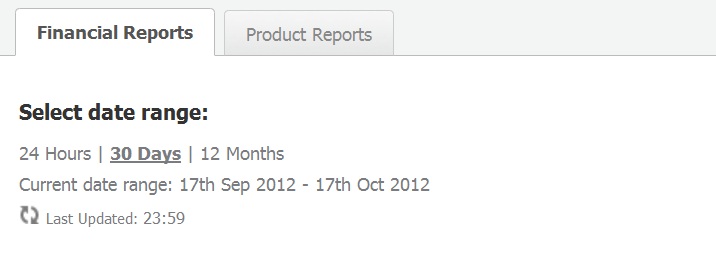
Financial Report Tab
You can choose to view your reports in three different date ranges; 24 hours, 30 days or 12 months.
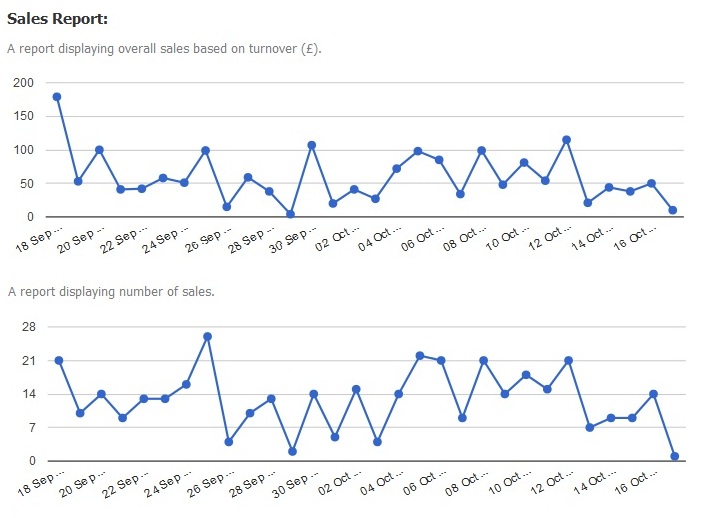
Sales Report
This is a report displaying your overall sales based on turnover.
Profit Report
This is a report displaying profit based on your products trade price. 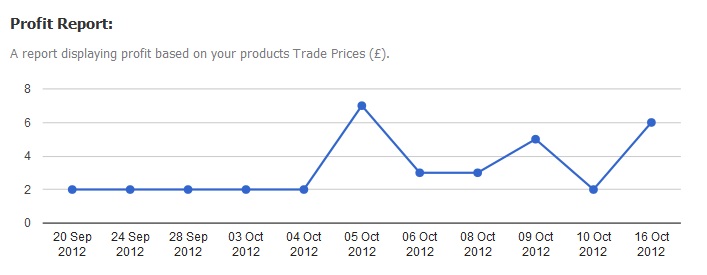
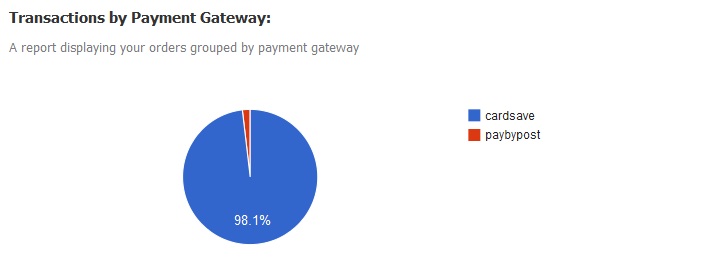
Transactions by Payment Gateway
This is a pie chart displaying your orders grouped by Payment Gateway. This will display the percentage of use for each of your Payment Gateways.
 Product Report Tab
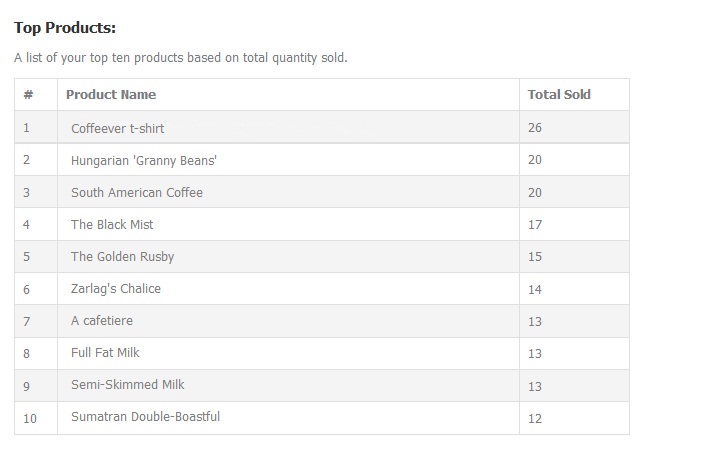
Top Products - This is a table listing your top five products based on total quantity sold and total value sold.
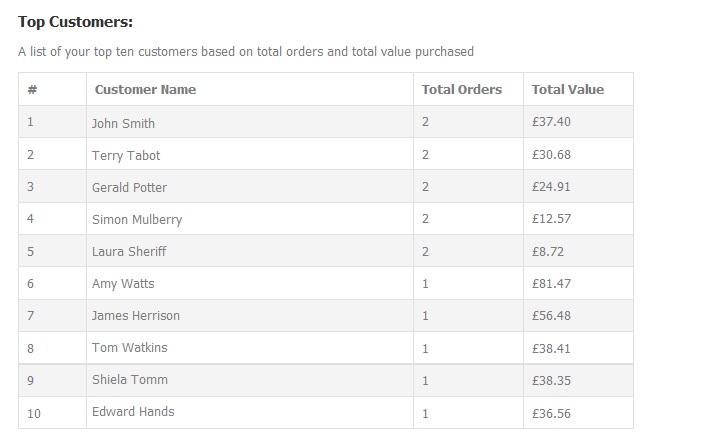
Top Customers
This is a table listing your top five customers based on total order value and total value purchased.
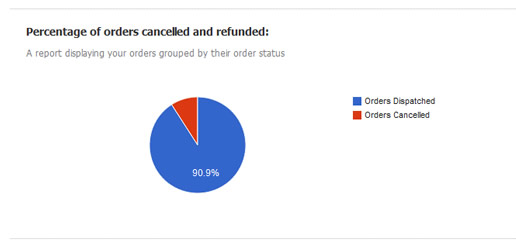
Percentage of orders cancelled and refunded
This is a pie chart displaying a report of your orders grouped in percentage by their order status.
Shop report statistics is available in real time on the Shop Builder Pro and Shop Builder Advanced packages. Choose the best package for you, compare our full list of features. Please note that all shop reports are in GMT time - our guide has more information relating to this.
Related Articles


More Questions?
If you have any further questions, please get in touch and we will be happy to help.
Get in Touch