Help Centre
Support > Promoting Your Website > Social Media
How To Use Open Graph (OG) Data for Sharing on Social Media
We all know the importance of standing out online and making the right first impression. Social media is one of the greatest tools for doing so, but how do you make sure your content stays consistent when shared on social media and always looks its best?
Enter Open Graph data (often shortened to "OG") a powerful yet often overlooked tool that can enhance the way your web pages and blog posts appear when shared on social media platforms like Facebook, Twitter, and LinkedIn.
In this guide, we'll demystify Open Graph data, explaining why it's important and providing you with best practices to make the most of the tags you write for your pages and posts.
Why Care About Open Graph Data?
Imagine a scenario: you've written a captivating blog post that you believe has the potential to engage and inform readers. You share the post across your social media channels. However, to your disappointment, the post appears with a cropped image, a confusing title, and a lack of context. What went wrong?
What’s happened is that without being given any data to work with, the social media platform has taken content from the page in order to create a preview. However, in most cases, this content isn’t optimised for sharing and therefore, you’ll end up with an image that isn’t the right size, and text that has been cut off and doesn’t offer the reader any reason to click through.
This is where Open Graph data comes to the rescue. Developed by Meta, Open Graph tags are snippets of code that provide essential information to social media platforms when your content is shared.

This information includes the title, description, image, and other points of data that shape the appearance of your shared content.
By adding Open Graph data to your web pages and blog posts, you gain control over how your content is presented, ensuring that your audience sees the intended message, visuals, and context the way you envisioned it.
With practice, you’ll be able to utilise open graph data to create an exciting preview that entices more people to click through and read your content, thus improving the success of your content launch.
You can view the information currently used for your website's Open Graph data here.
How To Add Open Graph Data to Your Blog

-
Go to the Content Tab and open your Blog
-
Click Post Settings next to the Blog you would like to add Open Graph Data to
-
Go to the bottom of the Meta Data tab
-
Here you can enter an Open Graph Title, Open Graph Description and specify an Open Graph Image for that post.
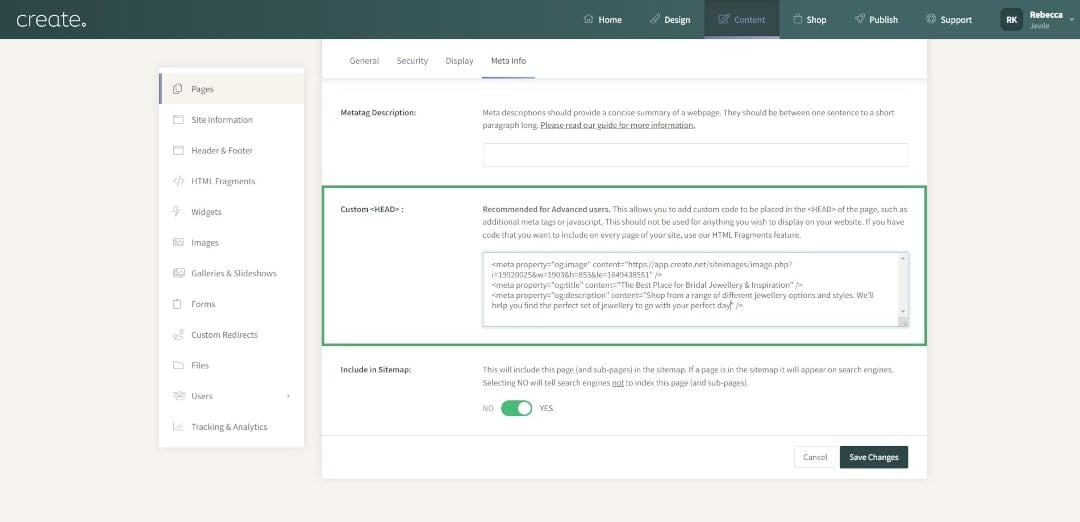
How To Add Open Graph Data to Pages of Your Site
-
Go to the Content Tab and click Page Settings next to the page you’d like to update
-
Navigate to the Meta Info tab and find the Custom : field
-
You can use the following lines of code to specify your Open Graph data:
OG Image** :
<meta property="og:image" content="YOUR IMAGE URL HERE" />
OG Title :
<meta property="og:title" content="YOUR TITLE HERE" />
OG Description :
<meta property="og:description" content="YOUR DESCRIPTION HERE" />
-
Save your changes
** To add an image, go to the Content Tab and Images in the left-hand menu. You can upload an image here. Click the preview button and right-click to get the image address which you can copy and paste into your line of code.
Best Practice for Open Graph Data
Now you know how to add Open Graph Data to your blog and website pages, let’s discuss how you can get the best results using these tools to improve your social media engagement and click-throughs:
Watch Your Character Lengths
Try to keep your OG Titles under 55-60 characters and your OG Descriptions under 65 characters. This will help to make sure none of your Open Graph data gets truncated when your content is shared.
Optimise Your Images
The ideal size for Open Graph Images is 1200 x 630 pixels. You can set up a project in Canva at this size to easily design images to complement your content. You can also optimise your images for file size and speed to have a greener impact.
Preview Your Open Graph Data
You can use Meta’s Sharing Debugger Tool to preview how your Open Graph Data presents when a link to your content is shared. Just enter your URL and hit Debug. This is a good habit to get into to make sure everything is displaying as you would expect.
Make It Eye-Catching
Remember that your Open Graph Data is designed to create a preview on social media, where everyone is vying for attention. Make sure your tags are all designed to make an impression and stand out in your audience’s busy feeds.
Make Sure Its Descriptive Of Your Content
No one likes clicking a link and finding out the content isn’t what they expected it to be. Make sure it’s clear what your content is about and the value your audience can expect to get from clicking through and reading your content.
Give People A Reason To Click Through
On the other side of the coin, it’s important to make sure your title and description entice your audience to click through and visit your website. Try to tailor your OG Data so the right people are tempted to click and don’t want to miss out on the content shared.
Run Open Graph Data Experiments
For the best results, it’s important to keep testing. You can use social media platform’s native analytics, or Google Analytics, to gauge how many people are clicking through. Experiment with different formats to optimise your content’s potential.
Related Articles

More Questions?
If you have any further questions, please get in touch and we will be happy to help.
Get in Touch