Blog > A Beginner's Guide to Google Analytics 4

Jack Lloyd
Product Marketer
I had been putting off getting started with Google Analytics 4 for a while. Universal Analytics felt familiar you know? I knew where everything was and the GA4 interface felt very alien.
The thing is, I hadn’t quite grasped just how powerful Google Analytics 4 really is. I didn’t know how easy it was to find useful insights, and how high the ceiling can go for finding meaningful insights for your online business.
The truth is, GA4 has so much to offer and getting started with their suite of new tools doesn’t need to be as daunting as you might first think.
If you’re just starting out with Google Analytics 4, I know how you’re feeling. That’s why I’m writing this blog. These are just a few views and tools that are easily accessible, but at the same time will help you feel right at home with the new platform.
Reports Snapshot
To Find:
-
Click Reports in the left-hand menu
-
It’ll be the page you land on
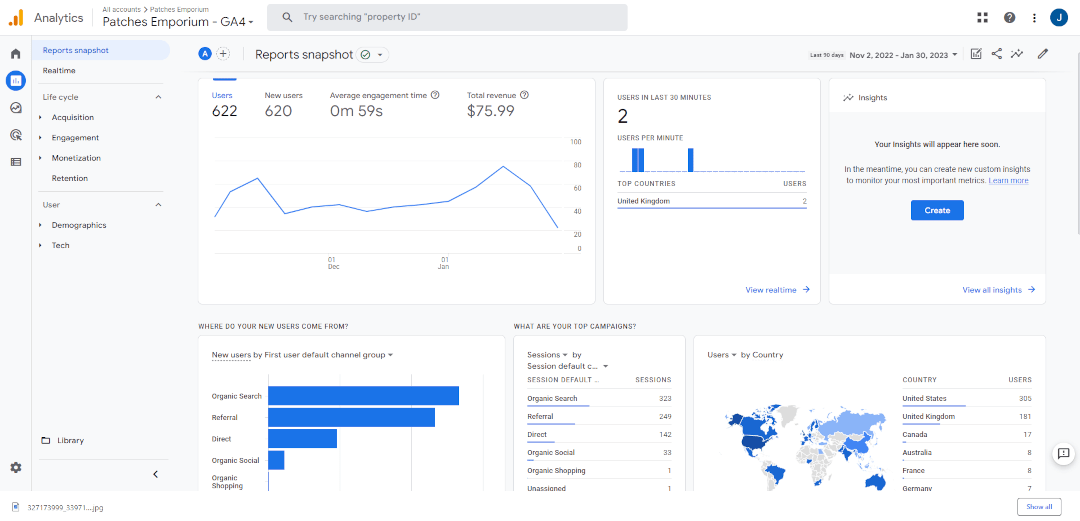
Reports Snapshot gives you a birds-eye view of some of the most important data being tracked in your account.
At a glance, you can see how many people have visited your site, how much revenue you’ve generated, the most important channels driving traffic to your site and lots more further down the page.
Immediately you can see if you’ve improved over a set time period, and where your efforts are showing the most results. It’s a brilliant page for finding key insights that you can dive into in more detail.
This page can also be customised with your own insights. In the top right of the screenshot above, you can see a space to create your own views that you’re tracking. By clicking Create, GA4 will guide you through the process of adding these to your Reports Snapshot.
Acquisition Tabs
To Find:
-
Click Reports in the left-hand menu
-
Open the Acquisition drop-down
-
Select your preferred report
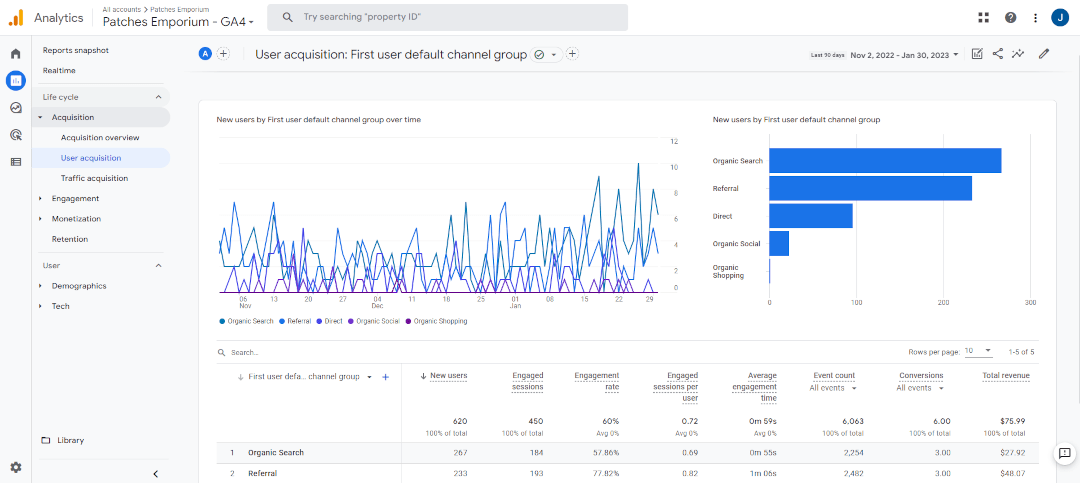
The Acquisition reports have been moved from universal analytics and had a significant upgrade.
These reports tell you immediately how people are coming to your site. It delves into how engaged those users are from each channel and if you’re an ecommerce site, how much revenue each channel has driven.
If you’re an ecommerce store or have conversion tracking set up, you’ll also see how your engagement from each channel translates to total revenue.
This information is incredibly useful when you relate them to your marketing efforts across each channel. You can see where the work you are putting in is paying off the most so you know where to focus your energy for the most results.
Note: The difference between the User Acquisition and Traffic Acquisition Reports is that User Acquisition reports on your new users whereas Traffic Acquisition reports on everyone.
Engagement Overview
To Find:
-
Click Reports in the left-hand menu
-
Open the Engagement dropdown
-
Click Engagement overview
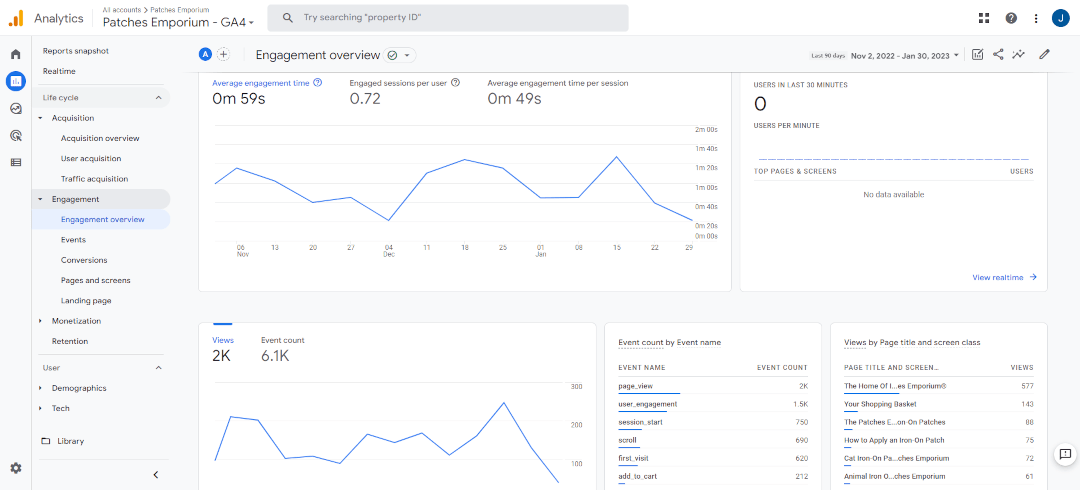
In Universal Analytics, we primarily had metrics like bounce rate and average time on page to interpret how engaged people are on a site (These metrics are still accessible if required)
Google Analytics 4 has revamped the way we approach engagement metrics. You’ll find the primary metrics at the top now are Average Engagement time, Engaged sessions per user and Average engagement time per session.
These offer a much more informative insight into how the majority of your users engage with your site. Changes that you make will be much more reflective of your site’s overall performance based on the number of people who visit.
Further down the report, you’ll find details about event completions (find examples of these in the Events report), your most viewed pages, activity over time and user stickiness. These all create a clearer picture of what people are doing, what they’re interested in and if they come back.
Note: User stickiness metrics are listed as DAU, WAU and MAU. These stand for daily, weekly and monthly active users.
In the screenshot above, it’s clear my site could benefit from a bit of work to improve engagement. I can look at my most viewed page first and work out what I can do to create a more engaging experience. Perhaps by changing my featured products and creating more calls to action.
You can find more ideas on improving engagement in our blog post about Bounce Rate >>
Events & Conversions
To Find:
-
Click Reports in the left-hand menu
-
Open the Engagement dropdown
-
Click Events or Conversions
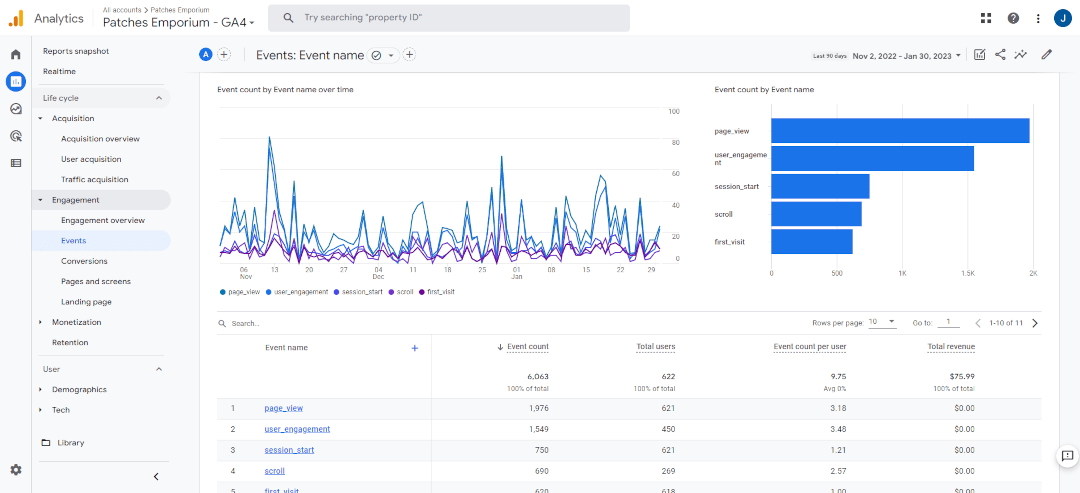
Some things that visitors do on your website mean more than others; like when someone adds an item to their basket or submits a form. These were once goals in Universal Analytics; they’re now defined as conversions in GA4.
Conversions are created by determining what actions are the most valuable to your website. You can clearly define rules for the conversion to be met by what actions are taken.
Events are simply just actions that are taken on your website. You’ll find that Google Analytics 4 has already set up some events for you. You can quickly mark which of these are valuable as conversions to you.
Simply go to Admin (in the left-hand menu) >> Events (under the property column) and mark each action you’d like to track as a conversion here. You’ll find two separate reports detailing how often each Event has been triggered and how often your conversions have been triggered; along with any values that have been defined for them.
Find out more about Events and Conversions >>
Ecommerce Purchases
To Find:
-
Click Reports in the left-hand menu
-
Open the Monetization dropdown
-
Select Ecommerce Purchases
If you have an ecommerce store, GA4 will offer you a ton more valuable insights without the work compared to Universal Analytics.
We spoke about Events and Conversions in the last section. Google Analytics 4 will already be tracking when products are viewed, added to basket, and purchased without you having to lift a finger.
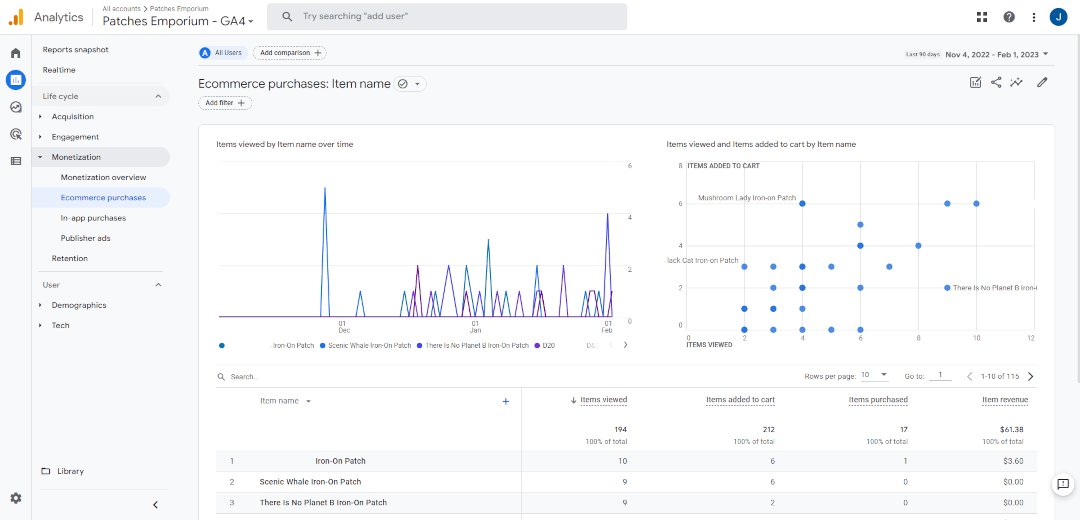
You can see all this information at a glance with the Ecommerce Purchases report. It showcases which of your products have been the most popular and how frequently your products are engaged with in any of the formerly mentioned ways.
This report is perfect for quickly discovering which of your products are the most popular and have the best conversions. You can use this information to create a featured products section on your home page to encourage more clickthroughs and sales.
It will also help you to identify where some of your products may be underperforming. If you find a product is being viewed many times but no one is adding it to their baskets, it could be an indicator that you need to update your product description to be more enticing.
Explore
To Find:
-
Click the Explore tab in the left-hand menu
- It’ll be the page you land on
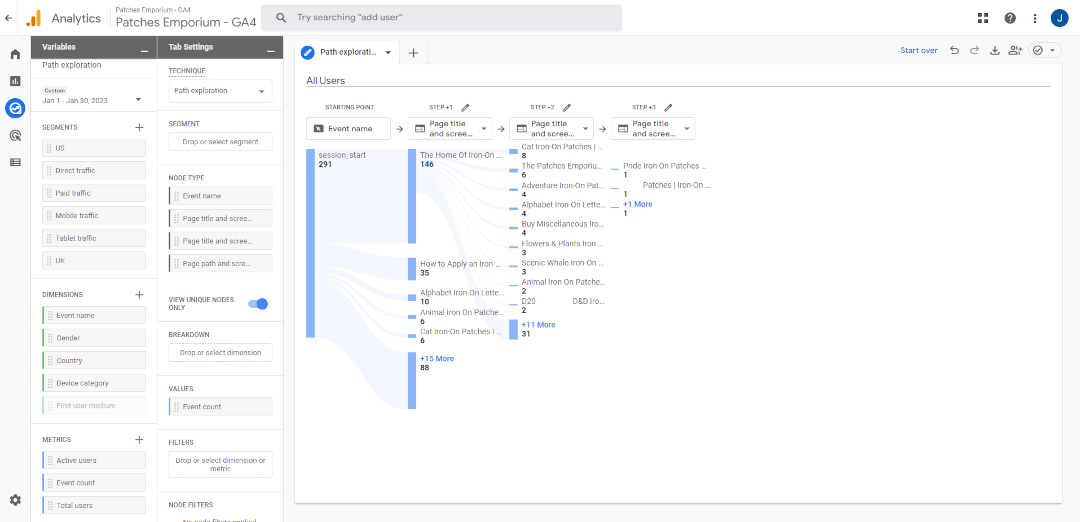
Explore is a powerful new feature that makes analysing the journey of your visitors more straightforward, yet highly customisable.
The above journey shows the different paths visitors to the Patches Emporium site take. Where they land on the home page and go to the main shop page. As you can see, there are a lot of visitors who deviate from this path and go straight to different products they’re interested in.
This is perfect for mapping out an intended journey and seeing what distracts from that journey, as talked about in our Website Objectives blog. Being aware of where people drop away from your site can help you to find new ways to keep them intrigued and increase the likelihood of them making a purchase or enquiry.
There are different formats for this graph that you can choose and loads of customisable filters so you can focus on only the visitors that you’re interested in.
Find out more about using the Explore tab >>
Wrapping Up
The reports in this blog only really scratch the surface of Google Analytics 4’s capabilities, but they do offer a starting point with which you can hopefully start to feel more acquainted with their system.
Just as with Universal Analytics, it takes a bit of a learning curve to understand where to get exactly the kind of data you need, but ultimately, their update to GA4 comes with a whole host more tools, while offering more useful insights at surface level.
If you haven’t yet set up Google Analytics 4, you can find out how to get started in our GA4 Help Guide >>
Want more tips and ideas on how to start and grow your website? You can make sure you never miss a trick by getting our email updates. We share the latest news from our blog along with tips and ideas you can utilise to grow your business online.